A few weeks ago I did a post, “Probability, Statistics and Udacity”. Udacity read the post, tweeted it and posted a link on their site. The increase in traffic to my site was astounding. This provided a whole new audience and a great opportunity to study the statistics generated by Udacity linking my site.
Udacity’s course on statistics starts tomorrow so it’s fitting that I publish this today. When I finish the course, I intend to revisit this post to see what insights taking the course gave me.
On day one I had 533 visits from humans as a result of Udacity. The second day was approximately 300 visits and then my traffic dropped off to normal levels.
Some of the statistics that have caught my interest:
Content:
On average, one out of every four visitors took the time to read more than one post. I really need to improve my choice of topics or my writing skills. Only one in four people reading a second post is pitiful.
Locations:
On day one there were 3 visitors outside the US for every one US visitor. On day two this ratio was up to five to one, with almost the same number of foreign visitors each day.
With the exception of the US, no individual country accounted for more than 10% of the traffic.
In order the highest number of visitors came from India, Germany, United Kingdom, Spain, Canada and Brazil
Traffic Sources:
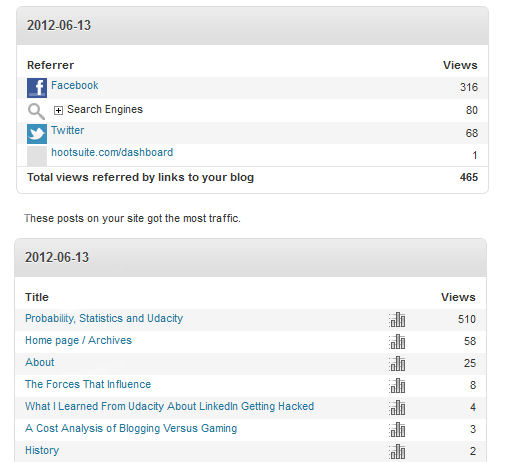
Almost as interesting were the sources that directed them to my site. On day one, Facebook accounted for almost 68% of my visitors. By day two this dropped to 52%. Google Plus accounted for 17% on day one and an amazing 32% on day two. The data suggests that there may be a propagation delay in the way news travels through those two media sites. Twitter remained steady at approximately 16% for both days.
Webcrawlers and Indexing Sites:
After taking Building a Search Engine at Udacity, I was not surprised to see how many webcrawlers there are out there. I get crawled on a regular basis by Google, Yandex (Russia), Baiduspider(China), Ezooms, Bingbot and a number of smaller ones hosted by compute-1.amazonaws.com.
I mention compute-1.amazonaws.com because some of those programmers really need to take Udacity’s course. In week five we were taught to keep track of the websites we crawled. After several (more than 10) of the amazonaws bots had crawled my one post for the hundredth time in two days, I just blocked them.
Brazil gets special mention in the webcrawler section. A number of servers running Googlebot operate out of Brazil. I thought at first this was Google but that would be like saying everything done with Safari represented Apple. The majority of Brazilian Googlebot servers are looking for websites where they can leave spam comments. The comments are always very generic with an attached URL that has nothing to do with the post. These servers probably accounted for 90% of the spam comments I was getting.
The Dark Side:
Last, there’s always that element that feels the need to hack into your site. During those two days I also had four visitors try to log into my site as “admin”. I think I’m as upset about them thinking I would leave it at “admin” as I am about their attempt to hack in.
There’s still one mystery under this heading. The increased notoriety did not seem to affect this at all but about once every two weeks, I will receive two attempts to exploit any TimThumb vulnerabilities I may have. The two attempts are always from different IP addresses and always within 60 seconds of each other. I mentioned this happening in an earlier post, ” A Milestone?” but the regularity of this just seems strange to me.
Final Thoughts:
How much of this has meaning? Am I missing any trends? We’ll see. I’m really looking forward to my courses starting tomorrow.
© 2012 – 2019, Byron Seastrunk. All rights reserved.


Recent Comments